BarChart
Draws a bar chart.
Examples
BarChart 1
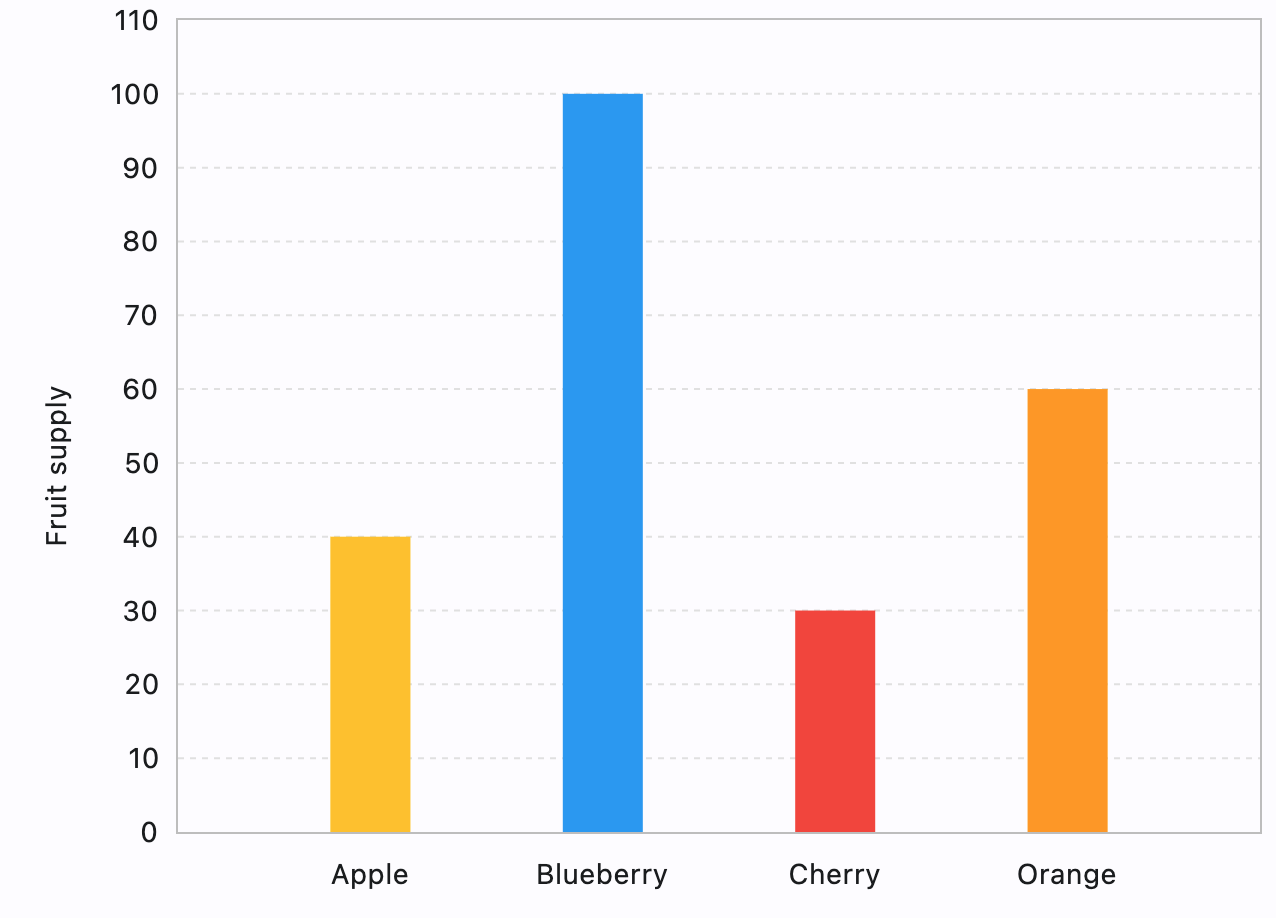
import flet as ft

def main(page: ft.Page):
    chart = ft.BarChart(
        bar_groups=[
            ft.BarChartGroup(
                x=0,
                bar_rods=[
                    ft.BarChartRod(
                        from_y=0,
                        to_y=40,
                        width=40,
                        color=ft.colors.AMBER,
                        tooltip="Apple",
                        border_radius=0,
                    ),
                ],
            ),
            ft.BarChartGroup(
                x=1,
                bar_rods=[
                    ft.BarChartRod(
                        from_y=0,
                        to_y=100,
                        width=40,
                        color=ft.colors.BLUE,
                        tooltip="Blueberry",
                        border_radius=0,
                    ),
                ],
            ),
            ft.BarChartGroup(
                x=2,
                bar_rods=[
                    ft.BarChartRod(
                        from_y=0,
                        to_y=30,
                        width=40,
                        color=ft.colors.RED,
                        tooltip="Cherry",
                        border_radius=0,
                    ),
                ],
            ),
            ft.BarChartGroup(
                x=3,
                bar_rods=[
                    ft.BarChartRod(
                        from_y=0,
                        to_y=60,
                        width=40,
                        color=ft.colors.ORANGE,
                        tooltip="Orange",
                        border_radius=0,
                    ),
                ],
            ),
        ],
        border=ft.border.all(1, ft.colors.GREY_400),
        left_axis=ft.ChartAxis(
            labels_size=40, title=ft.Text("Fruit supply"), title_size=40
        ),
        bottom_axis=ft.ChartAxis(
            labels=[
                ft.ChartAxisLabel(
                    value=0, label=ft.Container(ft.Text("Apple"), padding=10)
                ),
                ft.ChartAxisLabel(
                    value=1, label=ft.Container(ft.Text("Blueberry"), padding=10)
                ),
                ft.ChartAxisLabel(
                    value=2, label=ft.Container(ft.Text("Cherry"), padding=10)
                ),
                ft.ChartAxisLabel(
                    value=3, label=ft.Container(ft.Text("Orange"), padding=10)
                ),
            ],
            labels_size=40,
        ),
        horizontal_grid_lines=ft.ChartGridLines(
            color=ft.colors.GREY_300, width=1, dash_pattern=[3, 3]
        ),
        tooltip_bgcolor=ft.colors.with_opacity(0.5, ft.colors.GREY_300),
        max_y=110,
        interactive=True,
        expand=True,
    )

    page.add(chart)

ft.app(main)
BarChart 2
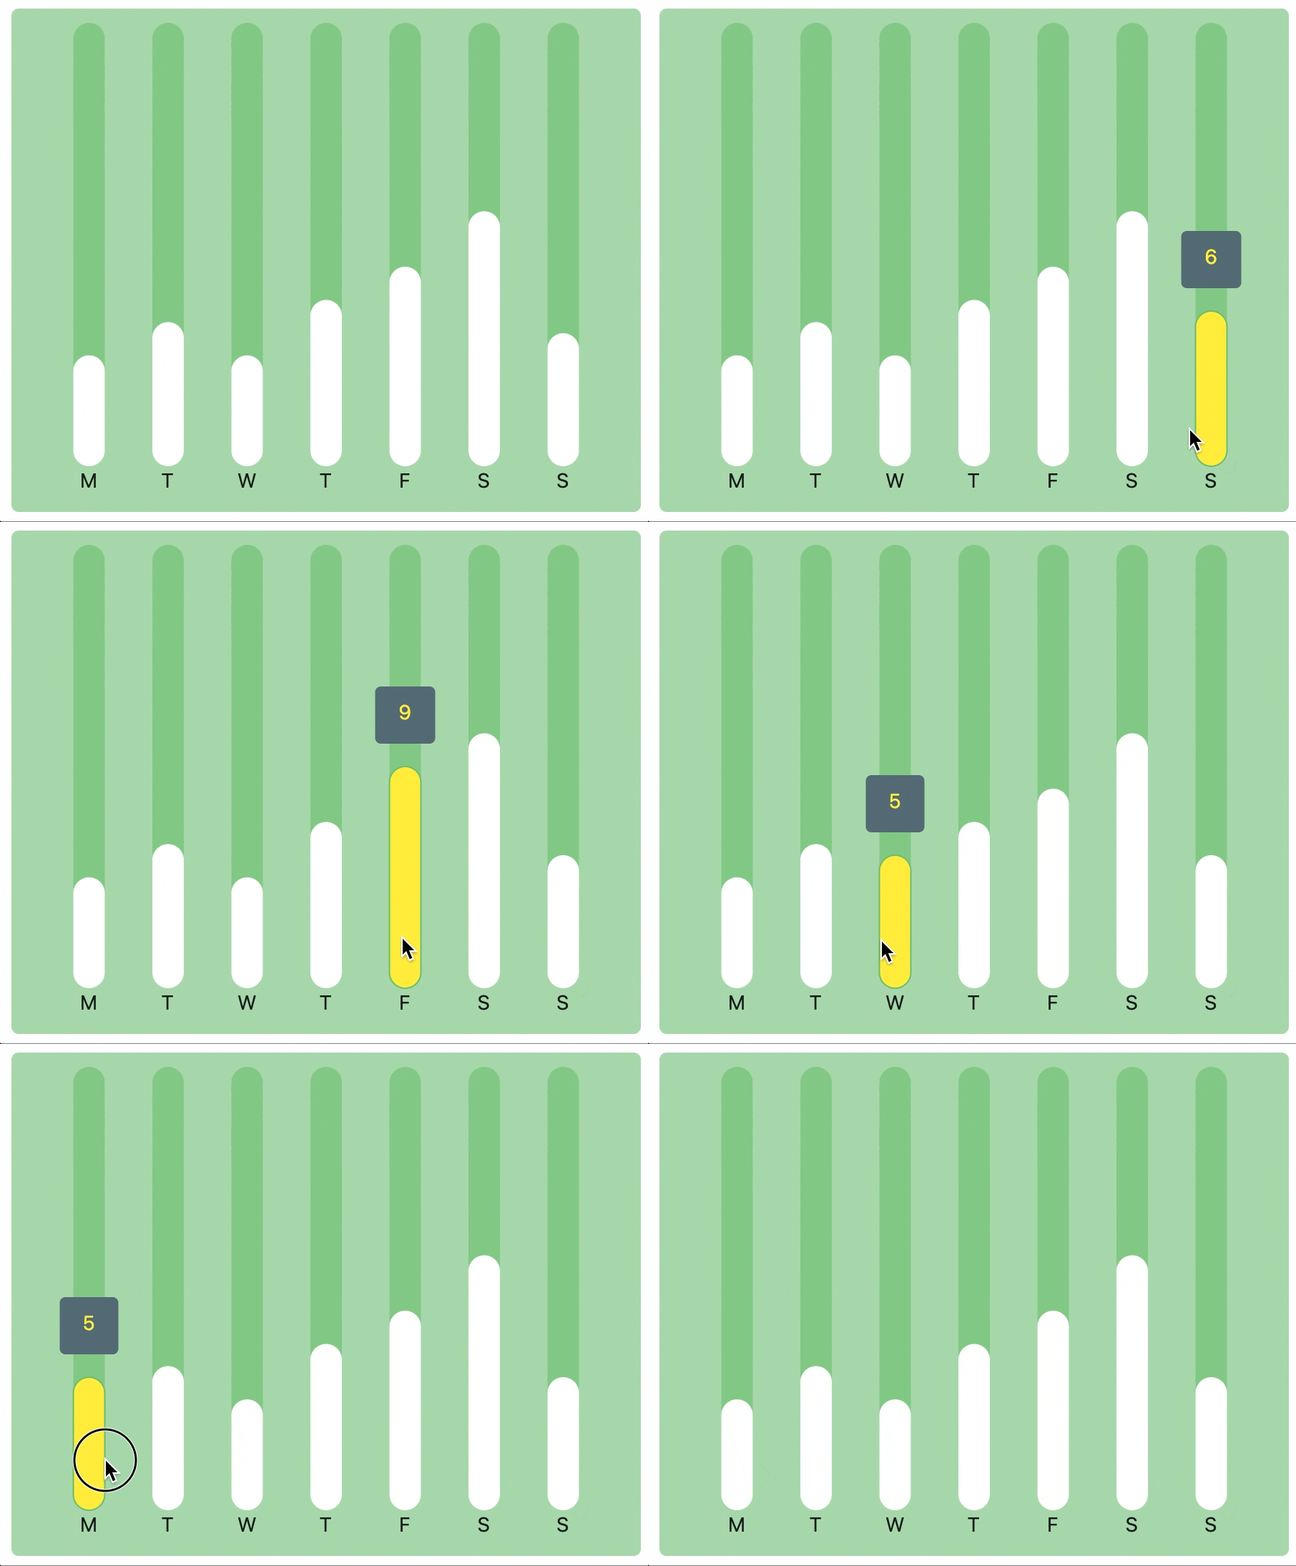
import flet as ft

class SampleRod(ft.BarChartRod):
    def __init__(self, y: float, hovered: bool = False):
        super().__init__()
        self.hovered = hovered
        self.y = y

    def _before_build_command(self):
        self.to_y = self.y + 1 if self.hovered else self.y
        self.color = ft.colors.YELLOW if self.hovered else ft.colors.WHITE
        self.border_side = (
            ft.BorderSide(width=1, color=ft.colors.GREEN_400)
            if self.hovered
            else ft.BorderSide(width=0, color=ft.colors.WHITE)
        )
        super()._before_build_command()

    def _build(self):
        self.tooltip = str(self.y)
        self.width = 22
        self.color = ft.colors.WHITE
        self.bg_to_y = 20
        self.bg_color = ft.colors.GREEN_300


def main(page: ft.Page):
    def on_chart_event(e: ft.BarChartEvent):
        for group_index, group in enumerate(chart.bar_groups):
            for rod_index, rod in enumerate(group.bar_rods):
                rod.hovered = e.group_index == group_index and e.rod_index == rod_index
        chart.update()

    chart = ft.BarChart(
        bar_groups=[
            ft.BarChartGroup(
                x=0,
                bar_rods=[SampleRod(5)],
            ),
            ft.BarChartGroup(
                x=1,
                bar_rods=[SampleRod(6.5)],
            ),
            ft.BarChartGroup(
                x=2,
                bar_rods=[SampleRod(5)],
            ),
            ft.BarChartGroup(
                x=3,
                bar_rods=[SampleRod(7.5)],
            ),
            ft.BarChartGroup(
                x=4,
                bar_rods=[SampleRod(9)],
            ),
            ft.BarChartGroup(
                x=5,
                bar_rods=[SampleRod(11.5)],
            ),
            ft.BarChartGroup(
                x=6,
                bar_rods=[SampleRod(6)],
            ),
        ],
        bottom_axis=ft.ChartAxis(
            labels=[
                ft.ChartAxisLabel(value=0, label=ft.Text("M")),
                ft.ChartAxisLabel(value=1, label=ft.Text("T")),
                ft.ChartAxisLabel(value=2, label=ft.Text("W")),
                ft.ChartAxisLabel(value=3, label=ft.Text("T")),
                ft.ChartAxisLabel(value=4, label=ft.Text("F")),
                ft.ChartAxisLabel(value=5, label=ft.Text("S")),
                ft.ChartAxisLabel(value=6, label=ft.Text("S")),
            ],
        ),
        on_chart_event=on_chart_event,
        interactive=True,
    )

    page.add(
        ft.Container(
            chart, bgcolor=ft.colors.GREEN_200, padding=10, border_radius=5, expand=True
        )
    )

ft.app(main)
BarChart properties

bar_groups
The list of ft.BarChartGroup to draw.
groups_space
A gap between bar groups.
animate
Controls chart implicit animation.
The value is of AnimationValue type.
interactive
Enables automatic tooltips when hovering chart bars.
bgcolor
Background color of the chart.
tooltip_bgcolor
Background color of tooltips.
border
The border around the chart.
The value is an instance of border.Border class.
horizontal_grid_lines
Controls drawing of chart's horizontal lines. The value is the instance of ChartGridLines class.
vertical_grid_lines
Controls drawing of chart's vertical lines. The value is the instance of ChartGridLines class.
left_axis
Configures the appearance of the left axis, its title and labels. The value is the instance of ChartAxis class.
top_axis
Configures the appearance of the top axis, its title and labels. The value is the instance of ChartAxis class.
right_axis
Configures the appearance of the right axis, its title and labels. The value is the instance of ChartAxis class.
bottom_axis
Configures the appearance of the bottom axis, its title and labels. The value is the instance of ChartAxis class.
baseline_y
Baseline value for Y axis. Default is 0.
min_y
Configures the minimum displayed value for Y axis.
max_y
Configures the maximum displayed value for Y axis.
BarChart events
on_chart_event
Fires when a bar is hovered or clicked.
Event data is an instance ft.BarChartEvent class with the following properties:
typeevent type such asPointerHoverEvent,PointerExitEvent, etc.bar_index- bar's index or-1if chart is hovered or clicked outside of any bar.rod_index- rod's index or-1if chart is hovered or clicked outside of any bar.stack_item_index- stack item's index or-1if chart is hovered or clicked outside of any bar.
BarChartGroup properties
x
Group position on X axis.
bar_rods
The list of BarChartRod objects to display in the group.
group_vertically
If set to True bar rods are drawn on top of each other; otherwise bar rods are drawn next to each other. Default value is False.
bars_space
The gap between bar rods.
BarChartRod properties
rod_stack_items
Optional list of BarChartRodStackItem objects to draw a stacked bar.
from_y
Specifies a starting position of a rod on Y axis. Default is 0.
to_y
Specifies an ending position of a rod on Y axis.
width
The width of a rod. Default is 8.
color
Rod color. Default is cyan.
gradient
Gradient to draw rod's background. The value must be an instance of one of the following classes:
border_radius
Border radius of a bar rod. Default is 4.
border_side
Border to draw around rod. The value is the instance of BorderSide class.
bg_from_y
An optional starting position of a background behind a rod.
bg_to_y
An optional ending position of a background behind a rod.
bg_color
An optional color of a background behind a rod.
bg_gradient
An optional gradient to draw a background with.
selected
If set to True a tooltip is always shown on top of the bar when BarChart.interactive is set to False.
show_tooltip
True (default) if a tooltip should be shown on top of hovered bar.
tooltip
A custom tooltip value. Default is to_y.
tooltip_style
A text style to display tooltip with. The value is the instance of ft.TextStyle class.
tooltip_align
An align for the tooltip. The value is the instance of TextAlign enum.
BarChartRodStackItem properties
from_y
The starting position for a stack item inside a bar rod.
to_y
The ending position for a stack item inside a bar rod.
color
A color of stack item.
border_side
A border around stack item. The value is the instance of BorderSide class.
ChartGridLines properties
Configures the appearance of horizontal and vertical grid lines within the chart.
interval
Interval between grid lines. Default is 1.
color
Color of a grid line.
width
Width of a grid line. Default is 1.
dash_pattern
Defines dash effect of the line. The value is a circular list of dash offsets and lengths. For example, the list [5, 10] would result in dashes 5 pixels long followed by blank spaces 10 pixels long. By default, a solid line is drawn.
ChartAxis properties
Configures chart axis.
title
A Control to display as axis title.
title_size
Width or height of title area.
show_labels
True to display labels along the axis. If labels is empty then automatic labels are displayed.
labels
The list of ft.ChartAxisLabel objects to set custom axis labels for only specific values.
labels_interval
The interval between automatic labels.
labels_size
Width or height of labels area.
ChartAxisLabel properties
Configures a custom label for specific value.
value
A value to draw label for.
label
A Control to draw as a label.